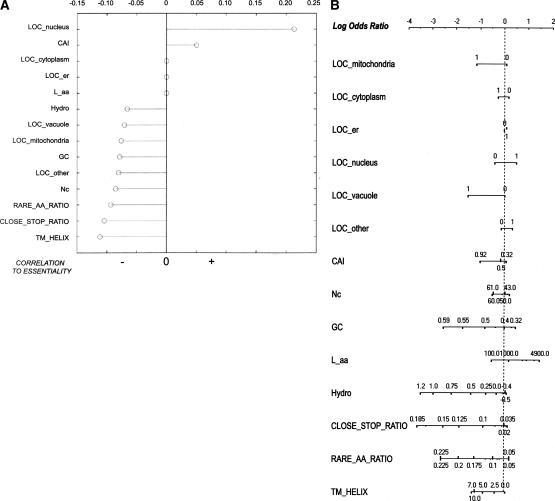
Figure 1.
(A) Stem plot of correlation coefficients of each feature with essentiality. Negative correlations are shown to the left of the vertical axis, positive correlations to the right. Correlation coefficients were filtered by P value: Coefficients with P > 0.05 (deemed not significant) were set to zero. (This occurred for features LOC_cytoplasm, LOC_er, and L_aa.) Higher-order correlations are not shown. (B) The nomogram for the Naive Bayes analysis, illustrating the relative contributions of each predictive feature to the target class (essentiality). For each feature, values are drawn along a line according to their influence on the target class: The longer the line, the more important the feature for final prediction. The top line gives the log-odds ratio. Given a set of feature states, a prediction can be obtained by performing a vertical lookup to the log-odds ratio for each feature state and summing the log-odds ratio contributions of all 14 features. The higher the sum, the more likely that gene is essential.

