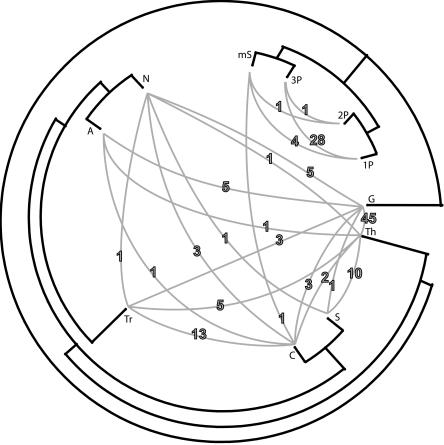
Figure 3.
Visualization of the evolutionary history of cyanobacteria as inferred from quartet decomposition analyses. The unrooted tree topology was calculated from the embedded quartets supported by the plurality of sets of orthologous genes, and it is shown in black. Conflicts to the plurality topology that involve two particular taxa grouping together with at least 80% bootstrap support are shown as gray lines connecting two taxa in conflict. The number of conflicting data sets that have the two connected taxa grouping together are shown on the corresponding gray line. Note that the number of conflicting sets shown represents only a small subset of observed conflicts to the plurality signal, since not all topological incongruencies are of this kind. The genes involved in conflicts, as well as corresponding topologies, are provided as Supplemental material. (A) Anabaena sp. PCC7120; (Tr) Trichodesmium erythraeum IMS101; (S) Synechocystis sp. PCC6803; (1P) Prochlorococcus marinus CCMP1375; (2P) Prochlorococcus marinus MED4; (3P) Prochlorococcus marinus MIT9313; (mS) marine Synechococcus WH8102; (Th) Thermosynechococcus elongatus BP-1; (G) Gloeobacter violaceus PCC7421; (N) Nostoc punctiforme ATCC29133; (C) Crocosphaera watsonii WH8501.

