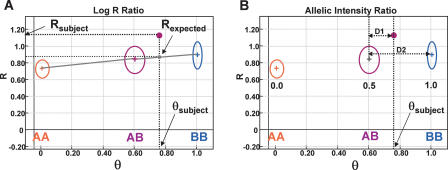
Figure 1.
Analyzing SNP-CGH data. (A) The log2 R ratio compares the observed normalized intensity (Rsubject) of the subject sample to the expected intensity (Rexpected; gray dot) based on the observed allelic ratio, θsubject, through a linear interpolation (gray lines) of the canonical clusters AA, AB, and BB (shown as circles) in the GenoPlot. The normalized intensity value obtained from a single SNP is represented as a purple dot. The R and θ values for the subject are shown with thick black dotted lines. (B) The canonical clusters (shown as circles) are also used to convert θ values, that is, θsubject, to B allele frequency (allelic copy ratio). This is accomplished by a linear interpolation of the known allele frequencies assigned to each cluster (0.0, 0.5, and 1.0). The allele frequency for an observed θ value falling between two clusters is also calculated by linear interpolation with lines D1 and D2. In the example shown, a data point falling approximately a third of the distance from the AB to the BB cluster (e.g., θsubject ∼ 0.76) has an allele frequency of 0.5 + 0.33 * 0.5 = 0.67. These two transformed parameters, log2 R ratio and B allele frequency, are then plotted along the entire genome for all SNPs on the array.

