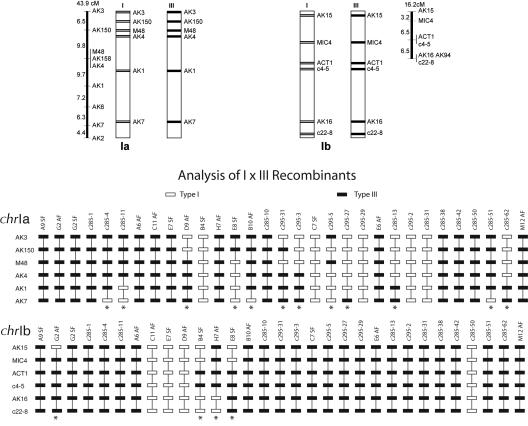
Figure 3.
Progeny from genetic crosses between the Type I and Type III lineage were analyzed using six polymorphic markers on each of chrIa and chrIb. The resulting allele patterns are shown for each of 31 progeny at each locus (solid boxes, Type III lineage; open boxes, Type I lineage). Progeny where recombination has occurred are indicated at the bottom by an asterisk. The maps at the top represent the linear genetic maps for each chromosome with the markers shown on the right and the genetic distances shown on the left in centiMorgans.

