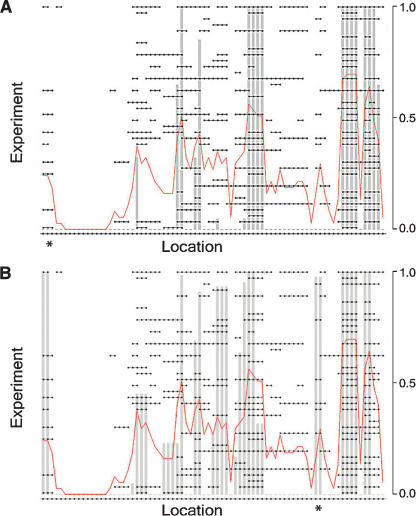
Figure 2.
Results for example data using frequency and footprint statistics. Display showing data from Figure 1 with overlay of the confidences, indicated by gray bars. The red line graphs the actual frequencies in the sample set. (A) Frequency only. (B) Footprint only.

