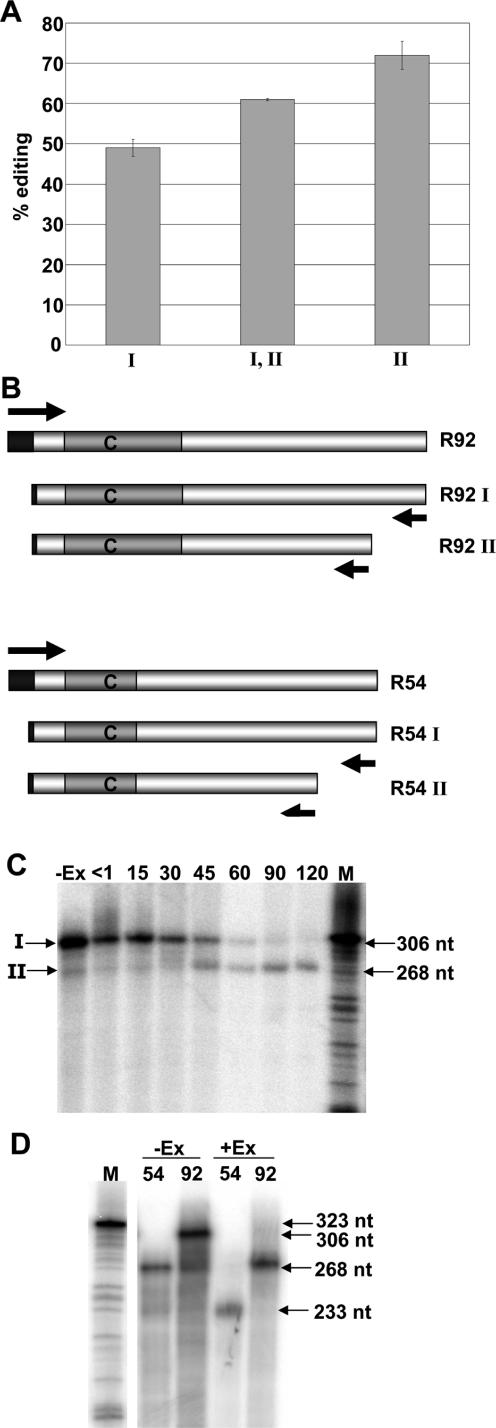
Figure 9.
In vitro editing of substrates corresponding to transgenic transcripts were incubated in chloroplast extract under in vitro editing conditions. Editing percentages were calculated by comparing poisoned primer extension reaction intensity and error bars represent one standard deviation from the mean. (A) Lanes (I) and (I, II), Substrates with either 3′ end I or both 3′ ends were amplified through selective RT–PCR from an initial RNA template equivalent to 3′ end I, respectively. Lane (II), substrate was amplified with 3′ end II from an RNA template with 3′ end II. (B) Diagram of DNA substrates created to express RNA templates corresponding to the transgenic transcripts. Arrows indicate primers used for PCR amplification. Bars represent DNA substrates, closed bars symbolize T7 sequence used for transcription in vitro and gray bars indicate the region of rpoB. (C) Incubating 5′ end-labeled RNA substrates under in vitro editing conditions. Lane −Ex, without chloroplast extract for 120 min. Lanes <1 through 120, with tobacco chloroplast extract for points indicated up to 120 min. Bands that correspond to S1 nuclease mapped ends I and II are indicated to the left of the figure. (D) Internally labeled RNA substrates for R54 and R92 were incubated with tobacco chloroplast extract, +Ex, and without extract, −Ex, for 120 min. (C and D) Lane M, sequencing reactions serving as a molecular weight standard with molecular weights in nucleotides are indicated to the right.

