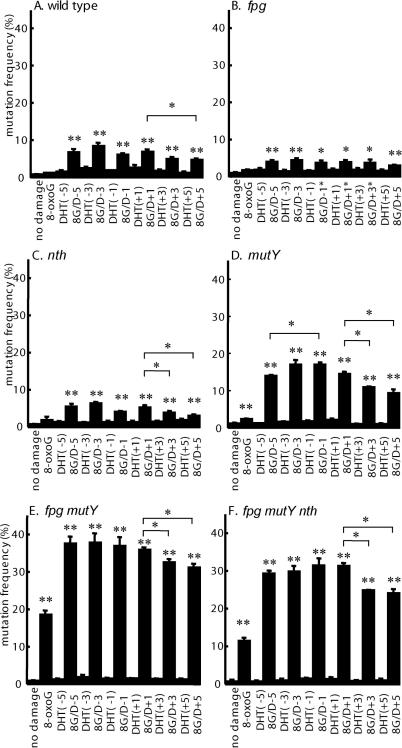
Figure 3.
Mutation frequencies (±SE) of clustered damage transformed into (A) wild type, (B) fpg strain, (C) nth strain, (D) mutY strain, (E) fpg mutY strain or (F) fpg mutY nth strain of E.coli. Types of damage are shown along the x-axis. The differences between a single 8-oxoG lesion and no damage, or between each type of clustered damage and a single 8-oxoG are shown where significant at the 5% (*) or at the 1% (**) level. Interlesion distance and lesion orientation also produce some significant differences at the 5% level (* above pairs of bars).

