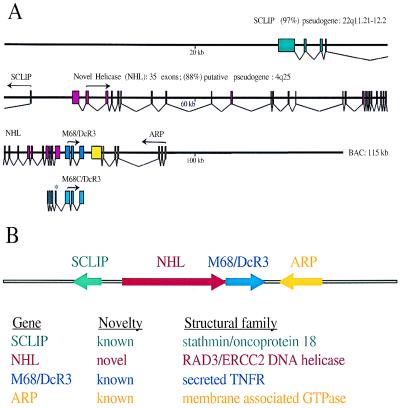
Figure 5.
Genomic structure of M68 and the adjacent genes. (A) Exon/intron organization of human M68 BAC genomic sequence. Exons, which are represented as shaded boxes, were determined by using the crossmatch program and manual editing to conform exon boundaries to standard splice-site consensus sequences. Arrows represent the translation initiation methionine and the direction of protein translation. (B) Schematic representation of the M68 gene cluster and family structure.

