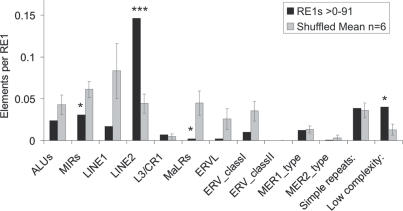
Figure 7.
Association of RE1s with TE classes. The numbers of TEs identified in the proximal flanking region (<100 bp) of all human RE1s were measured using the tool RepeatMasker. As a reference, the sequences identified by the six shuffled RE1 PSSMs (Figure 2C) were analysed in the same way. Statistical significance was calculated using Student's t-test (*P < 0.05, ***P < 0.001).

