
Figure 4.
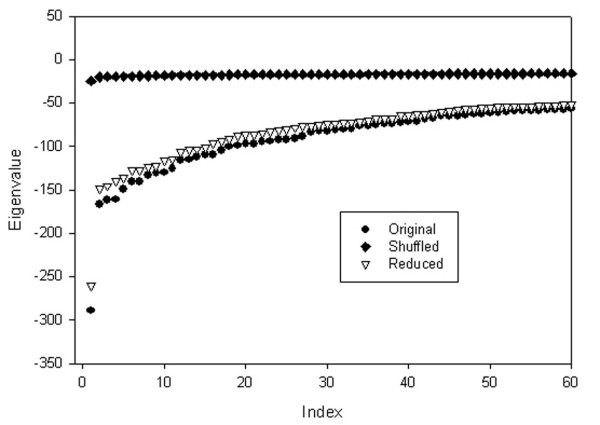
Comparison of eigenvalue distributions for (a) the GRID yeast protein interaction matrix (denoted as Original), (b) the randomly shuffled matrix that has same number of connections as the original matrix (Shuffled), and (c) the matrix that has 10% fewer interactions than the original matrix (Reduced). There is a clear difference between randomly shuffled case and the original or reduced GRID data sets.