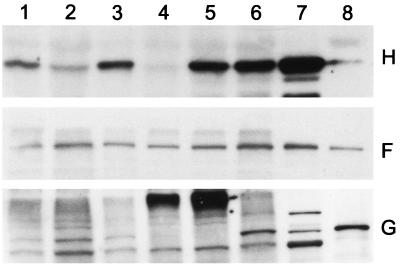
Figure 3.
Western blot analysis of the barley Mg-chelatase subunits XANTHA-H (Top), XANTHA-F (Middle), and XANTHA-G (Bottom). Lanes: 1, Chlorina-125; 2, Chlorina-157; 3, Chlorina-161; 4, xantha-h57; 5, xantha-g28; 6, xantha-f10; 7, wild-type chloroplast high-speed supernatant; and 8, wild-type chloroplast high-speed pellet. The molecular masses of the standard bands labeled in lanes 7 and 8 are 42 kDa for H, 150 kDa for F, and 76 kDa for G.

