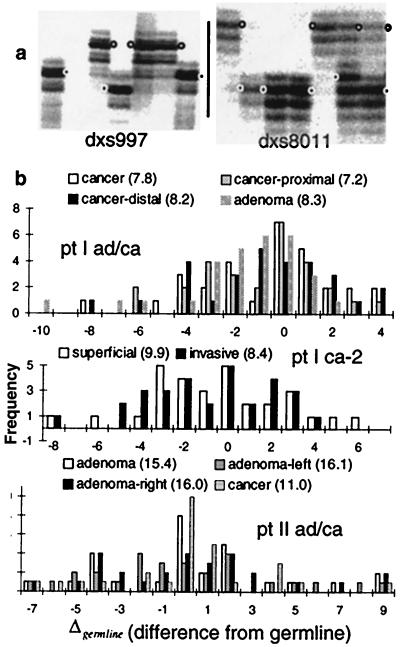
Figure 3.
(a) Autoradiographs of human tumor MS alleles. After dilution and PCR, the germline alleles (open circles) and tumor specific alleles (filled circles) become evident. Although the tumor alleles are polymorphic, they exhibit a modal size [−2 for DXS997 in the invasive cancer of Patient V (left) and −5 for DXS8011 in the right adenoma region of Patient II (right)]. (b) The differences from germline (Δgermline) of the 21–30 different MS loci from Patients I or II. Broader distributions, summarized by their variances (Sloci2 in parentheses), indicate greater numbers of divisions since the loss of MMR (see Fig. 1 and compare with Fig. 2). Different regions from the same tumor have similar distributions and Sloci2 values.

