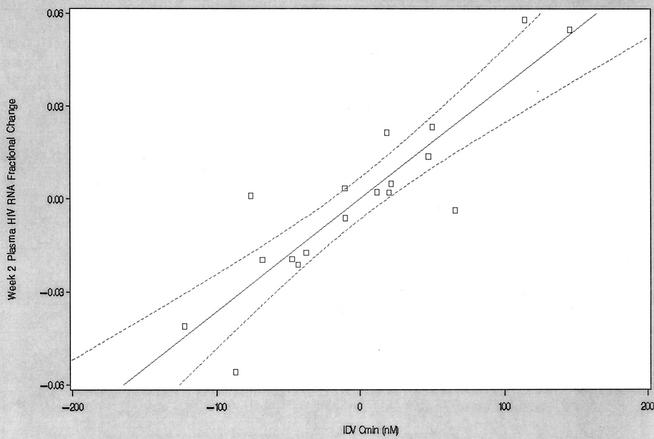
FIG. 1.
Partial regression plot of fractional change in plasma HIV RNA concentration at week 2 versus the indinavir Cmin. The final model included data for 18 subjects. The solid line represents the line of partial regression, and the dashed lines represent the 95% confidence ellipses about the line of partial regression. IDV, indinavir.

