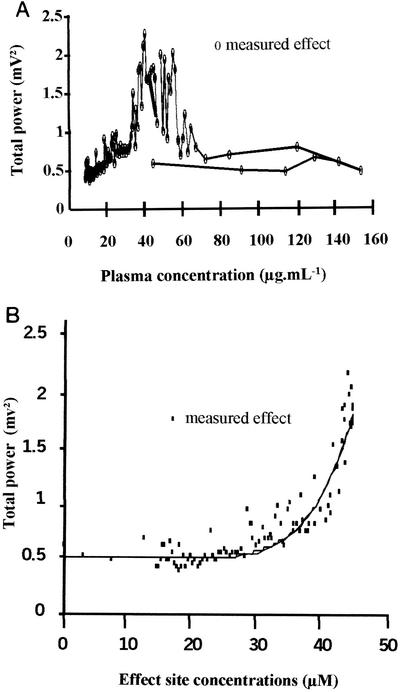
FIG. 1.
(A) Total power of the EEG signal versus NOR concentrations in plasma in a representative rat. (B) Total power of the EEG signal versus NOR concentrations at the effect site for a representative rat. The solid line represents the best fit of the data according to the spline function model (equation 9).

