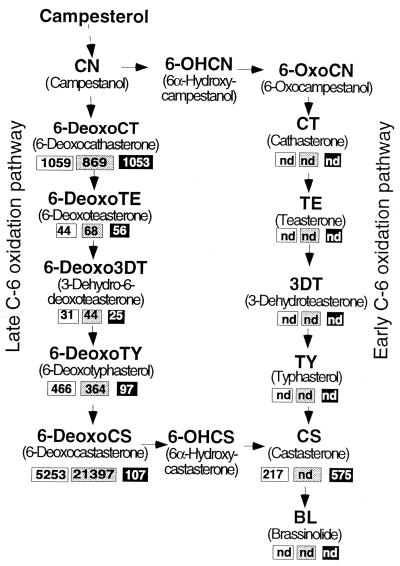
Figure 4.
Brassinolide biosynthetic pathway and brassinosteroid content of tomato lines. Brassinosteroid amounts, in nanograms per kilogram fresh weight, of D, dx, and 35S∷D plants are shown in white, gray, and black boxes, respectively. nd, not detected, i.e., the BR concentration was below the detection limit.

