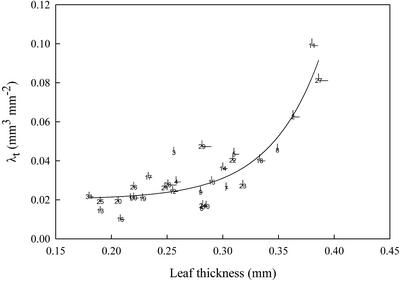
Figure 2.
The regression [y = 0.02 + 1.55 × 10⁻⁵ × exp (21.85 × x); r2 = 0.80; P < 0.0001] between the leaf thickness (x) and the λt (y) of the heterobaric leaves of 31 plant species. Species numbers are indicated in Table I. Points are means (six samples) and bars denote se.

