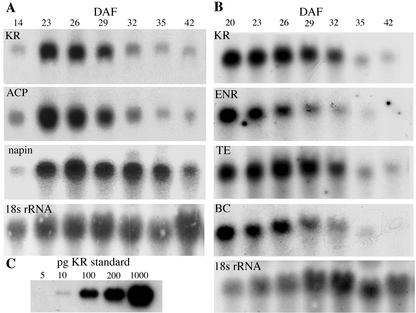
Figure 1.
Steady-state mRNA levels during embryogenesis. A, The profile for KR and ACP; B, the profile for KR, ENR, TE, and BC. C, Hybridization to a dilution series of antisense KR mRNA (5–1,000 pg) that was loaded into a second series of wells before electrophoresis was completed. Results were normalized after reprobing with an 18S rRNA sequence. The seed storage protein napin gene was used to probe blot A and showed a different temporal steady-state expression pattern.

