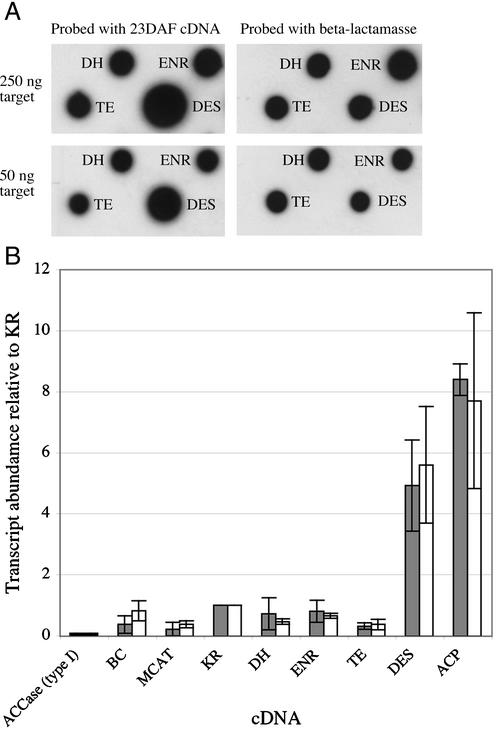
Figure 3.
Filter-array analysis of FAS and lipid biosynthetic genes. A, Sections of the filter showing high expression of DES compared with TE. The filters were hybridized with first-strand cDNA from 23 DAF embryo mRNA and β-lactamase, which was used as a loading control. Analysis was carried out on duplicate blots containing 50 and 250 ng of each target sequence. B, Transcript abundance of components of lipid biosynthesis, relative to KR = 1.0. Filled bars represent 50 ng and white bars 250 ng of each target sequence.

