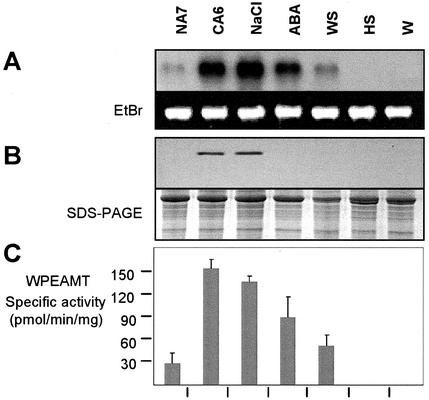
Figure 5.
Up-regulation of WPEAMT during CA and salt stress. A, Accumulation of Wpeamt mRNAs under different stress conditions. The 28S ribosomal band stained with ethidium bromide is included to show RNA loads (7.5 μg). B, Immunoblot showing the WPEAMT accumulation. Coomassie Brilliant Blue-stained gel shows the Rubisco band as load control. C, WPEAMT activity using P-EA as substrate in soluble fractions of wheat during stress treatments. Values represent the mean ± se from four independent experiments. NA7, Nonacclimated plants grown for 7 d; CA6, 6-d cold-acclimated plants; NaCl, plants treated with 300 mm NaCl for 18 h; ABA, plants treated with 0.1 mm ABA for 18 h; WS, plants exposed to water stress for 18 h; HS, plants exposed to 40°C for 3 h (heat shock); W, wounding stress for 3 h.

