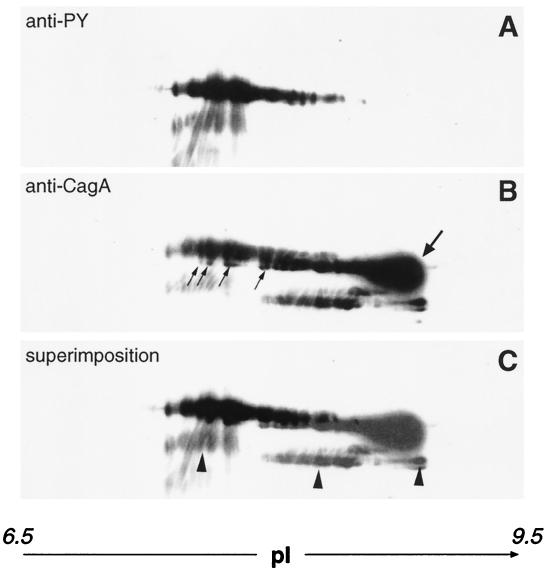
Figure 3.
Two-dimensional gel electrophoresis showing the similar migration pattern of PTYR and CagA. Infected AGS cells were denatured in electrophoresis buffer. After analysis by two-dimensional gel electrophoresis (16), the proteins were transferred onto poly(vinylidene difluoride) membrane. The membrane was probed with anti-PY (A) and then stripped and reprobed with polyclonal anti-CagA antibody (B). (C) A superimposition of A and B. Arrows in B point to the unphosphorylated form of CagA, and the major proteic spot at higher pI is indicated by a bold arrow. The CagA spots with slightly lower molecular masses are indicated with regular arrows. Arrowheads in C indicate a degradation product.

