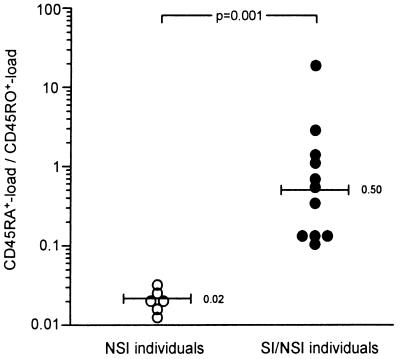
Figure 1.
Ratio of virus load in CD45RA+ and CD45RO+ CD4+ T cells. The ratio between the frequency of infected CD45RA+CD4+ T cells and the frequency of infected CD45RO+CD4+ T cells is shown for individuals with only NSI variants and individuals with both SI and NSI variants. Individuals with an undetectable virus load in the CD45RA+ cells were excluded (N1, N8, S7, S12; Table 1). The numbers and bars in the graph indicate median values.

