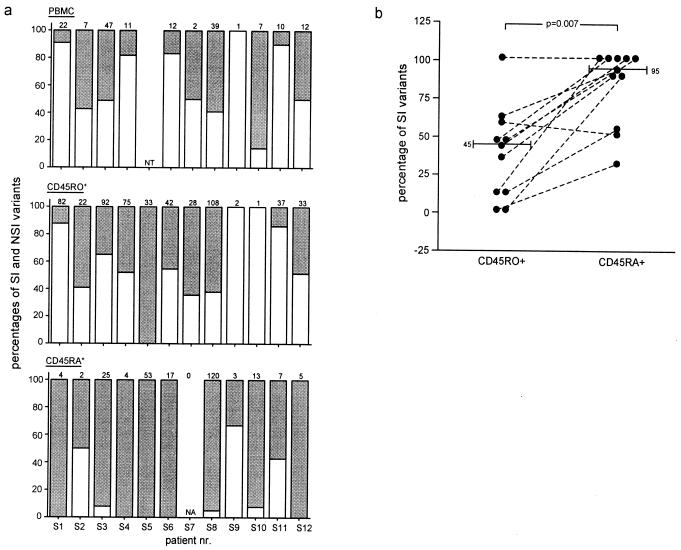
Figure 2.
Distribution of SI and NSI variants in total CD4+ T cells, CD45RA+, and CD45RO+ CD4 T cells. The total number of biological virus clones that were obtained by cocultivation with healthy donor PBL of total PBMC (a, Top), CD45RO+CD4+ T cells (a, Middle), and CD45RA+CD4+ T cells (a, Bottom) of SI carrying individuals are depicted at the top of each panel in a. The open bars represent the proportion of NSI clones, and filled bars represent the proportion of SI clones. Total PBMC from patient S5 was not analyzed (a, Top). No biological clones were obtained from CD45RA+CD4+ T cells from patient S7 (a, Bottom). The difference in the proportion of SI variants in CD45RO+ and CD45RA+ cells was analyzed for the individuals with detectable CD45RA+ load (b). The numbers and bars in the graph indicate median values. NT, Not tested. NA, not applicable.

