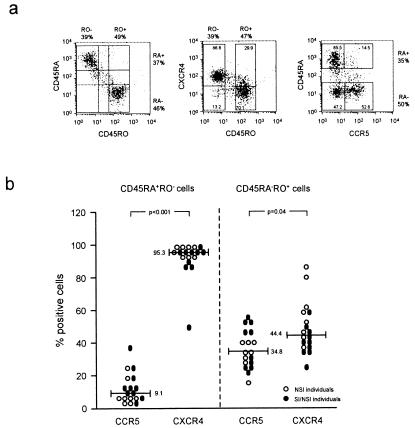
Figure 3.
CCR5 and CXCR4 expression on CD45RA+ and CD45RO+ CD4 T cells. Using three-color flow cytometry, the percentages CCR5- and CXCR4-positive naive and memory cells were determined. FACScan images of one representative patient (S11) are shown (a). CD4+ lymphocytes were gated according to their forward and side scatter and CD4 staining. (Left) CD45RA vs. CD45RO staining. (Middle) CD45RO vs. CXCR4 staining. (Right) CD45RA vs. CCR5 staining. The proportion of CD45RAhigh cells corresponded with the proportion of CD45RO− cells, and the proportion of CD45RA− cells corresponded with the proportion of CD45ROhigh cells; the percentages are depicted on the outside of the graphs. The percentages of CXCR4-expressing CD45RO+ (RA−) and CD45RO− (RA+) cells and percentages of CCR5-expressing CD45RA+ (RO−) and CD45RA− (RO+) cells are depicted in the graphs. For all individuals, with NSI variants only (○) or with SI variants (●), these percentages are shown in b. The numbers and bars in the graph indicate median values.

