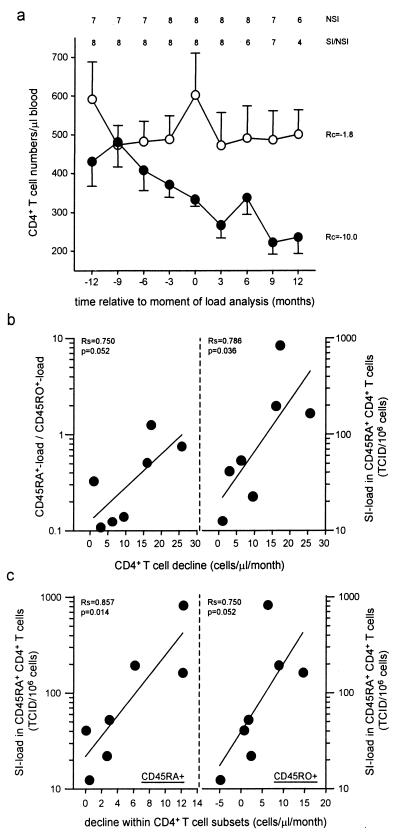
Figure 4.
CD4+ T cell decline and virus load for the 2-yr period spanning the moment of virus isolation and virus load determination (t = 0). The average CD4+ T cell counts per 3-mo interval were calculated for individuals with NSI variants only (○) and individuals with SI variants (●) (a). At the top of a, the number of included patients is shown. The linear regression coefficients (Rc) are depicted. Bars indicate the SEM. For the SI-carrying individuals, the correlation between CD4+ T cell decline and the relative virus load (Left) as well as the absolute SI load in the CD45RA+ cells (Right) was analyzed (b), and the correlations between the CD45RA+ SI load and the decline in CD45RA+ (Left) and CD45RO+ CD4+ T cells (Right) were analyzed (c). The Spearman correlation coefficients (Rs) and the P values are shown.

