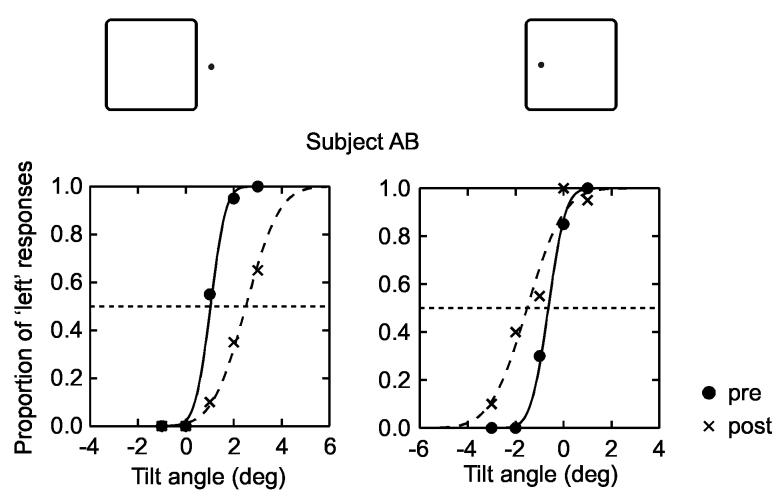
Fig. 4.
Demonstration of concurrent tilt aftereffects of opposite direction for the two sides of border ownership. Psychometric functions for one subject. The proportion of tilt responses is plotted as a function of the tilt of the test line for the two test figure locations (which were presented in random order). Filled dots and solid lines, pre-adaptation responses; crosses and dashed lines, post-adaptation responses. The adaptation produced a rightward shift of the psychometric function when the test figure was located on the left, and a leftward shift if the test figure was located on the right.

