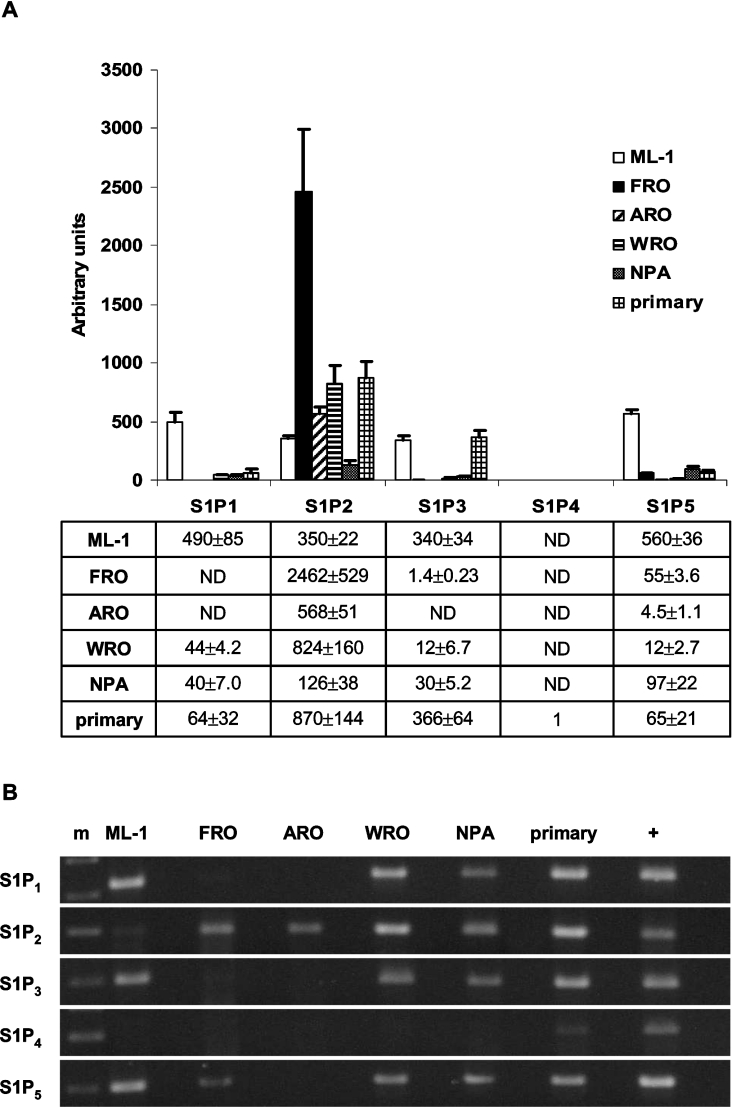
Figure 1. S1P receptor expression in thyroid cancer cell lines and primary cultures.
(A) Relative S1P receptor mRNA expression data presented as multiples of one, with one being the detection limit of the assay. ND, not detected. Results are means±S.E.M., n=4. (B) The expression of S1P receptor mRNA visualized as PCR products separated on an agarose gel and stained with ethidium bromide. m, molecular marker; +, positive control cDNA (human brain for S1P1, S1P2 and S1P5; human heart for S1P3; and HeLa cells for S1P4).

