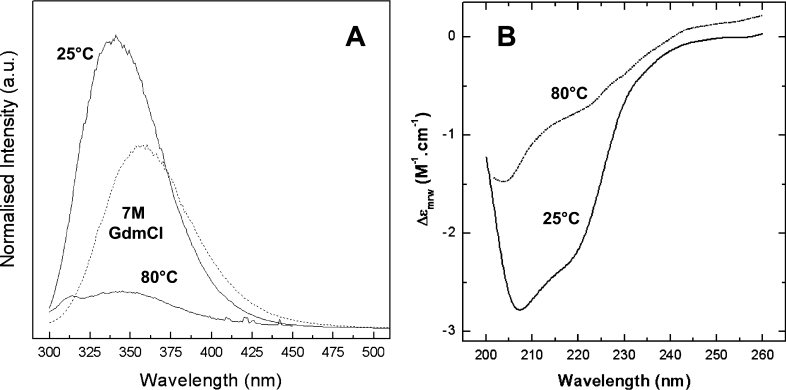
Figure 1. Spectroscopic characterization of wild-type Hfra-(91–210) in different conformational states.
(A) Fluorescence spectroscopy. Emission spectra of the native form (25 °C), and the chemically (7 M GdmCl) and thermally (80 °C) denaturated forms. (B) Far-UV CD spectroscopy. Spectra of the native and thermally denaturated forms. a.u., arbitrary units.

