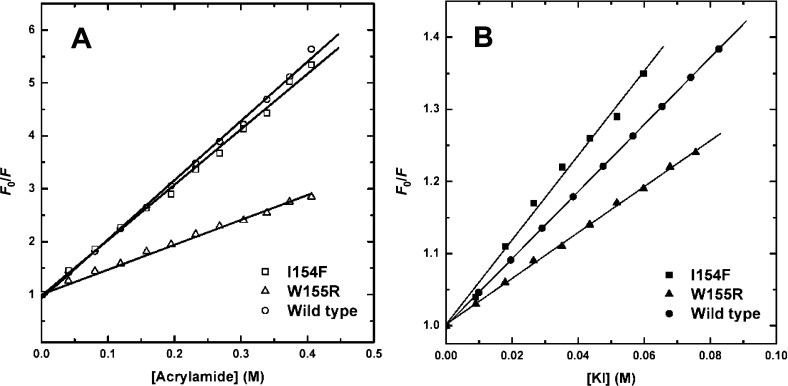
Figure 3. Stern–Volmer plots of acrylamide and iodide quenching of frataxin tryptophan fluorescence.
Plots of F0/F against concentration of acrylamide (A) and iodide (B) for the native wild type Hfra-(91–210) (○), W155R Hfra-(91–210) (△) and I154F Hfra-(91–210) (□). See Table 3 for parameters.

