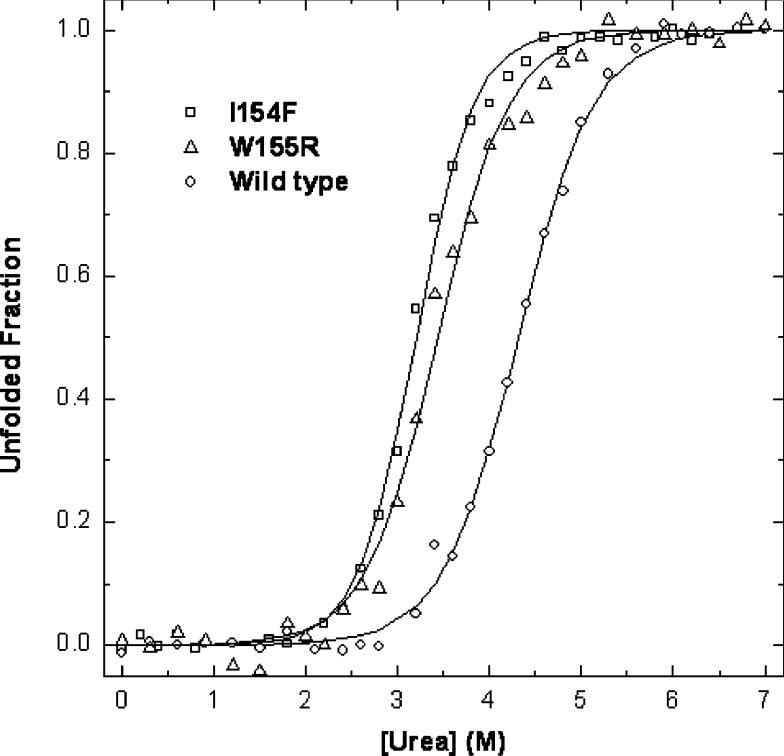
Figure 5. Comparison of chemical denaturation of FRDA Hfra-(91–210) mutants at pH 7.0.
The wild-type Hfra-(91–210) (○) denaturation curve with urea is compared with that of Hfra-(91–210) W155R (△) and Hfra-(91–210) I154F (□). See Table 4 for parameters characterizing the urea denaturation.

