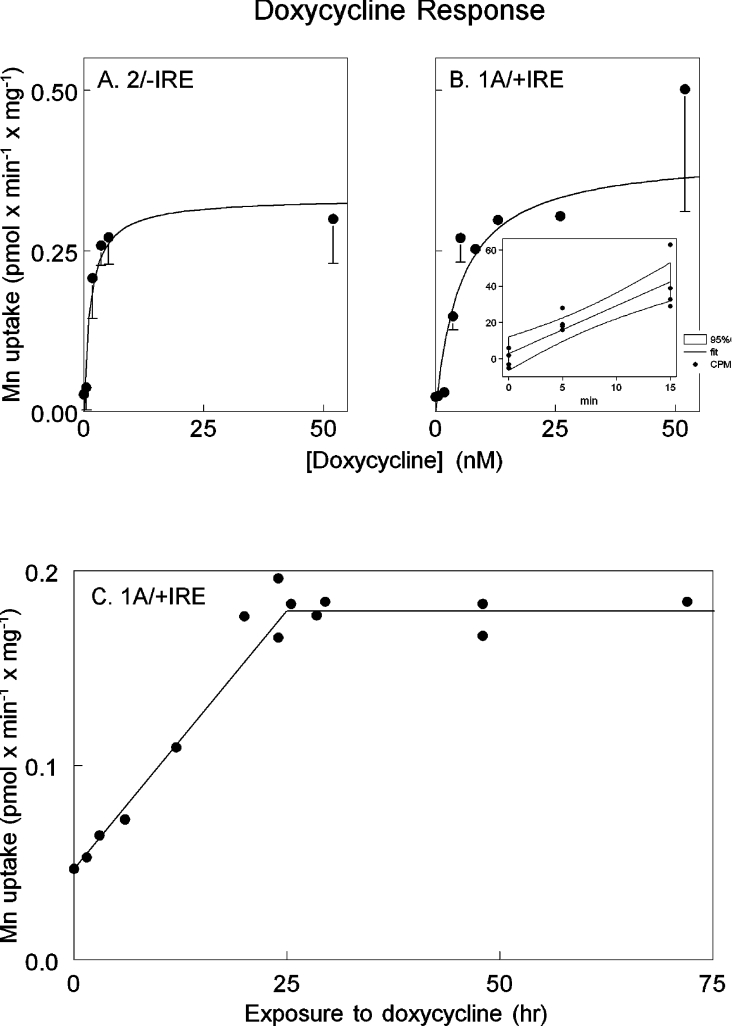
Figure 2. Response of Mn transport to doxycyline.
The 2/−IRE cell line (A) or the 1A/+IRE cell line (B) were grown to ∼60% confluence and then exposed to the concentrations of doxycyline indicated for 24 h. We calculated the rate of uptake of Mn without doxycycline treatment, as illustrated for the 1A/+IRE cells in the inset panel. Multiple wells are represented by a single point showing incorporated 54Mn2+ at the indicated time. The counts/min incorporation data were fitted to a linear regression and the 95% confidence interval calculated. Each point in the larger plots was the slope of a regression expressed as pmol/min per mg of cell protein and error bars indicate the confidence interval. (C) The 1A/+IRE cell line was exposed to 50 nM doxycycline for the times indicated and 54Mn2+ incorporation was determined over a 10 min period. We obtained similar data for the 2/−IRE cell line after 24, 48 and 72 h of doxycycline exposure, but did not examine the first 24 h as extensively (results not shown).

