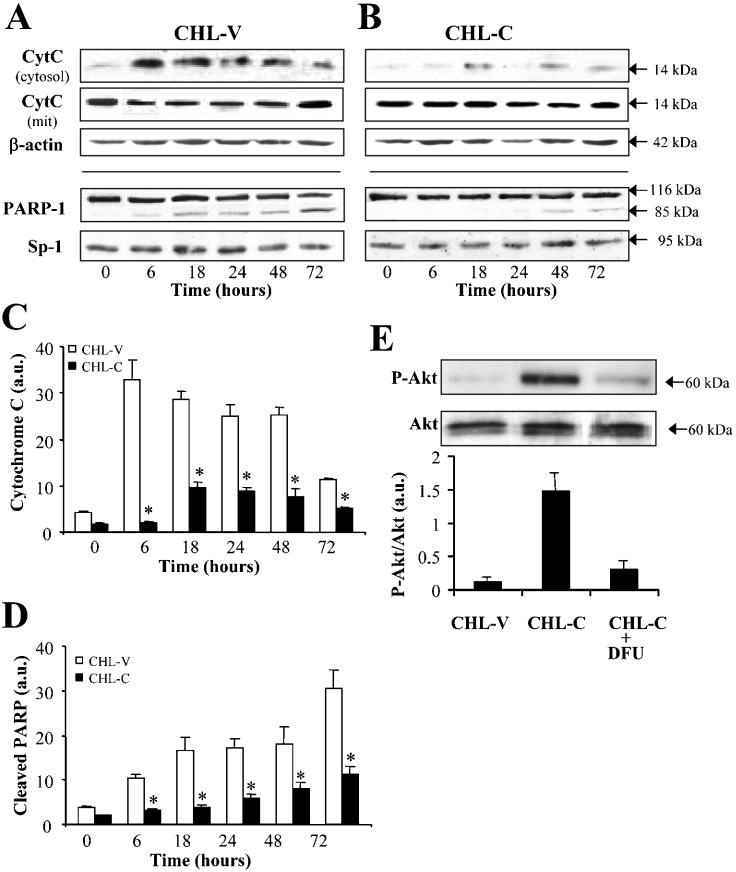
Figure 6. Cytochrome c, PARP-1 and phospho-Akt changes in CHL-V and CHL-C cells.
The presence of cytochrome c in the cytosolic and mitochondrial fractions after controlled lysis of the cells, and the levels of PARP-1 were analysed by Western blotting (A–D). Blots were normalized with β-actin (whole-cell and cytosolic extracts) or Sp1 (nuclear extracts). Total and phospho-Akt levels were determined in the same total cell extract in the presence or absence of 5 μM DFU (E). Representative Western blots are shown (n=3), and data are the means±S.D. for five independent experiments. *P<0.05 compared with the corresponding CHL-V cells. a.u., arbitrary units.

