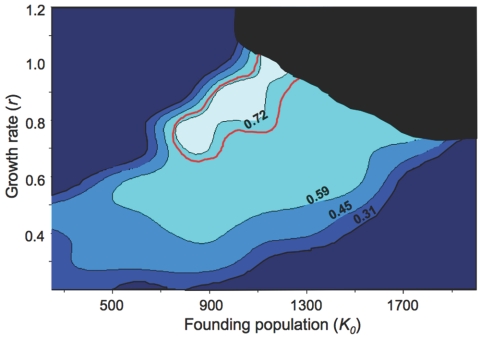
Figure 3. .
Contour plot of the fit between simulated and empirical data (R2) for the size of the initial founding population K0 and the growth rate within demes (r). Lighter areas represent better fits between simulations and actual data. The black area represents unrealistic regions of the parameter space, corresponding to a colonization of the world achieved in <1,500 generations. The red line delineates the 95% CI. The best fit between simulations and empirical data (R2>0.72) is obtained for high values of r (∼0.7–1.0) and a founding population, K0, of 800–1,200 individuals.

