Figure 1. .
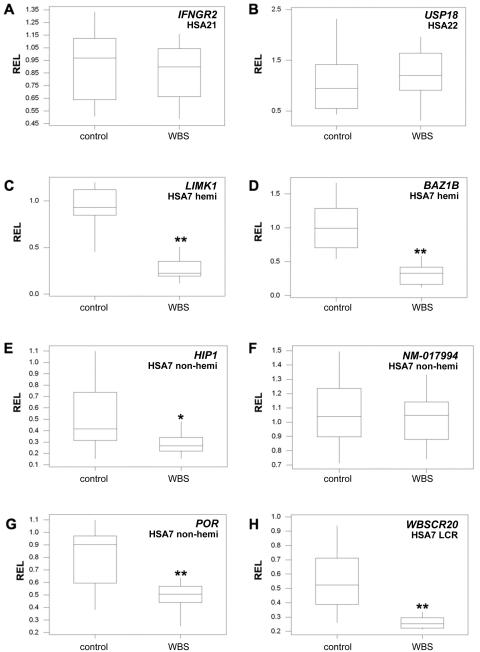
REL distributions measured in 14 patients with WBS and in 14 control skin fibroblasts. REL boxplots are shown for control genes (IFNGR2 [A] and USP18 [B]), for hemizygous genes that map to the commonly deleted WBS interval (LIMK1 [C] and BAZ1B [D]), for nonhemizygous genes that map to the flank of the commonly deleted WBS interval (HIP1 [E], NM_017994 [F], and POR [G]), and for LCR genes that map to the repeats flanking the WBS deletion (WBSCR20 [H]). Asterisks indicate P<.04 and double asterisks indicate P<.005, at both t and Mann-Whitney tests.

