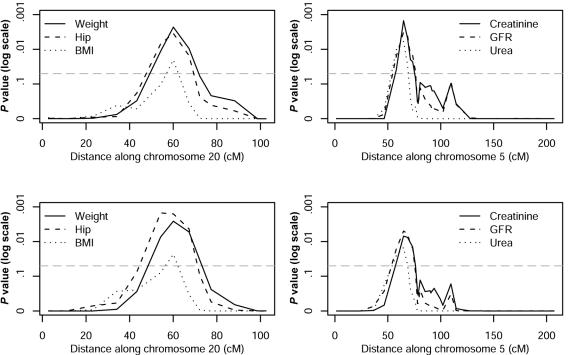
Figure 1. .
P values for body mass and renal function–related traits that achieved genomewide significance on chromosomes 20 and 5, respectively. The results of the analysis of raw residuals and ranked data are shown in the top and bottom panels, respectively. The dotted line indicates the genomewide 5% significance threshold.

