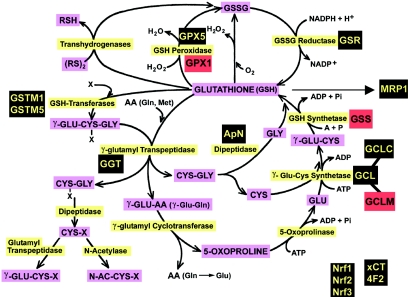
Figure 1. .
GSH metabolic pathway. The genes for which expression was studied in fibroblast cultures from skin biopsies are highlighted. Black indicates no difference between controls and patients, and red indicates lower expression in patients compared with controls. These genes code for the enzymes highlighted in yellow. Substrates and products are highlighted in purple. Genes not directly involved in GSH metabolism but included in the expression study: Nrf1, Nrf2, and Nrf3 = NF-E2–related transcription factors 1, 2, and 3, respectively; xCT and 4F2 = genes encoding proteins involved in cystine/glutamate exchange; and MRP1 = multidrug resistance protein 1. ADP = adenosine diphospate; GSSG = glutathione disulfide; RSH = reduced thiols; RS = disulfide; N-AC-CYS-X = N-acetyl-cysteine conjugate; Pi = inorganic phosphate.

