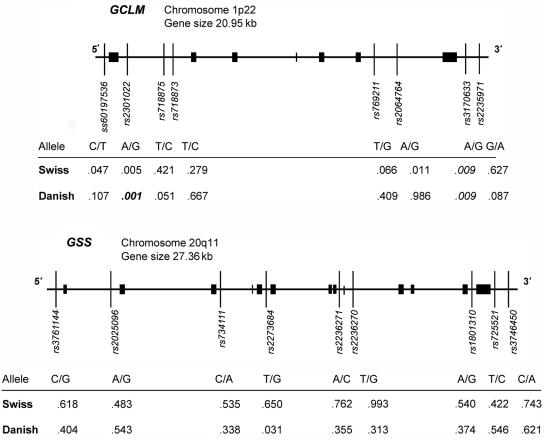
Figure 2. .
Map of GCLM and GSS genomic structures, with the positions of SNP markers and results of two case-control studies. Tables show P values for each SNP in case-control studies of subjects from two independent populations, from Switzerland and Denmark. Values in italics indicate a significant difference, and the value in bold italics indicates a significant difference after correction for multiple testing.

