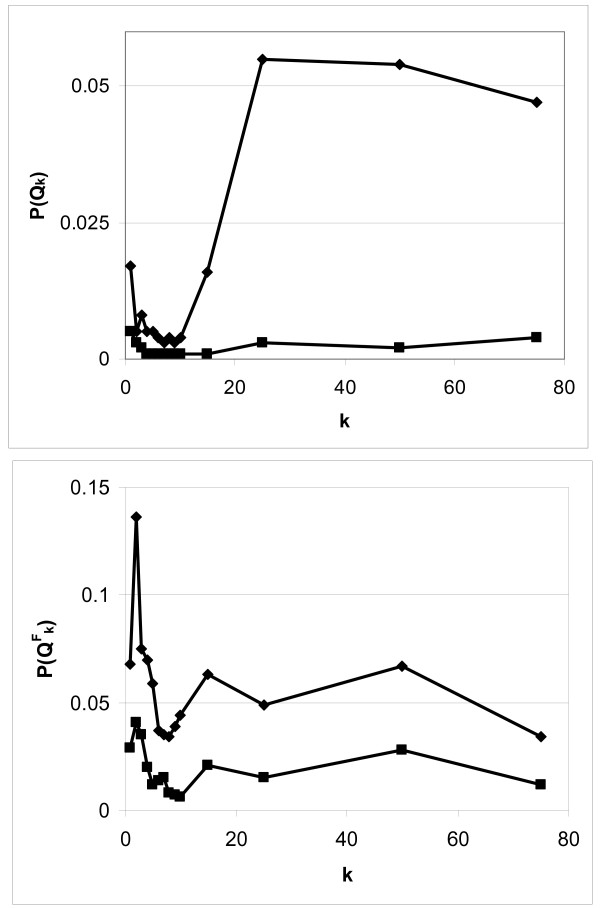
Figure 2.
Sensitivity to k, the number of nearest neighbors. Global (top graph) and focused (bottom graph) statistics before (diamonds) and after (squares) covariate adjustement. After covariate adjustment the p-value reaches a minimum at k = 7 for the global statistic and k = 8 for the focused statistic.

