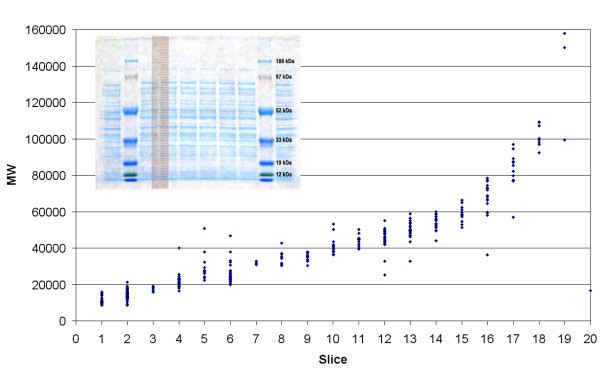
Figure 2.

Correlation of identified protein molecular weights with SDS-PAGE gel slices. The x-axis indicates the molecular weight in Daltons of identified proteins in each gel slice. y represents the slice number of the gel from bottom of the gel (lower molecular weight) to the top of the gel (higher molecular weight).
