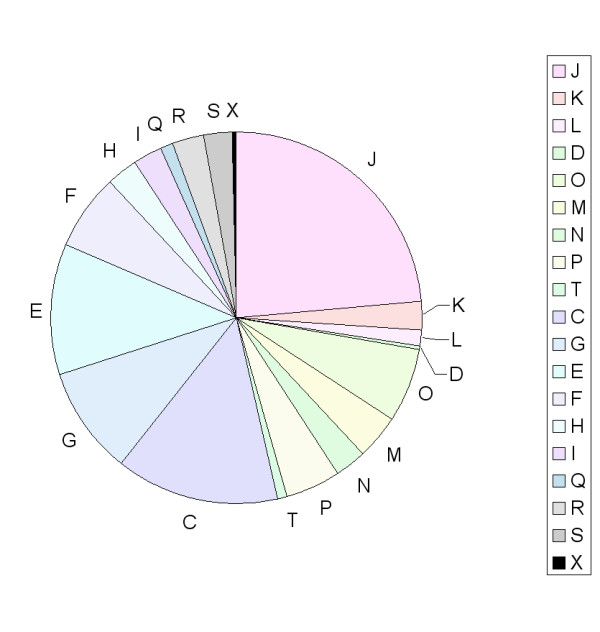
Figure 4.

COG Category distribution of identified biofilm ECM proteins. The percent distribution of identified proteins in terms of their assigned COG categories. The chart is color-coded as per COG colors at the NCBI COG functional annotation siteP http://www.ncbi.nlm.nih.gov/COG/old/palox.cgi?fun=all. COG category groupings are as follows: JKL – Information storage and processing; DOMNPT – Cellular processes; CGEFHIQ – Metabolism; RS – Poorly characterized. Categorization presented here reflects original COG categorization. In updated categorization P is included in Metabolism. X indicates a protein with no affiliated COG category.
