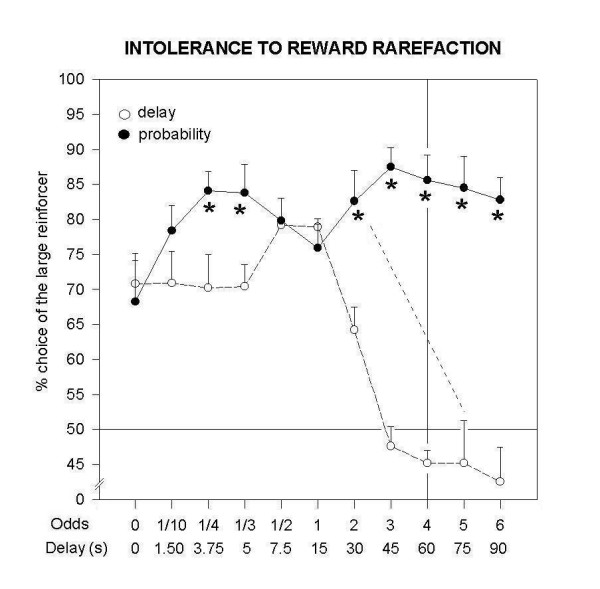
Figure 2.

Choice behavior in rats (n = 8) tested with either the intolerance-to-delay (ID) or the probability discounting (PD) protocols, shown during subsequent daily sessions. Data represent the mean (± SEM) choice (%) of the larger reinforcer, delivered either after a delay (LL in the ID protocol) or with a certain degree of probability (LLL in the PD protocol). In correspondence to each odds level, delay duration to be run was calculated a priori (see also Table 1). Equivalence between odds/probability and delay was re-estimated a posteriori (see e.g. dotted line). The vertical line shows the mathematical indifference point in the PD task, separating the field before (left to the line) from beyond (right to the line) it. The horizontal line shows the level of rats' indifferent choice, separating preference for LL/L (above the line) from preference for SS (below the line). * p < 0.05 when comparing across protocols within a given daily session.
