
Figure 2.
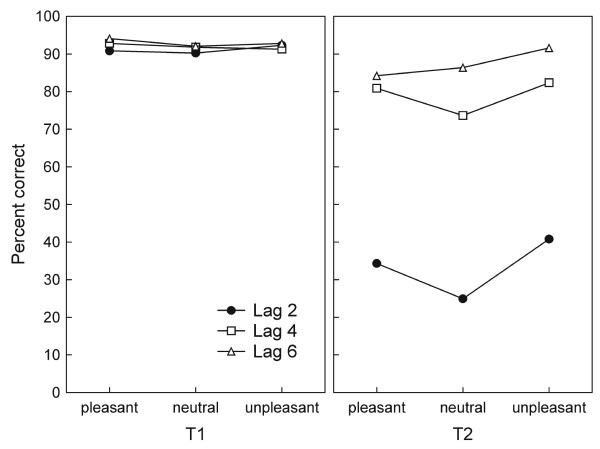
Identification accuracy. T1 performance (left panel) did not differ as a function of emotional content or lag. In contrast, T2 performance (expressed as percentage of correct trials, given that T1 was correctly identified in the same trial; right panel) showed sensitivity to lag and emotional content. Values reflect a mean of 13 participants.