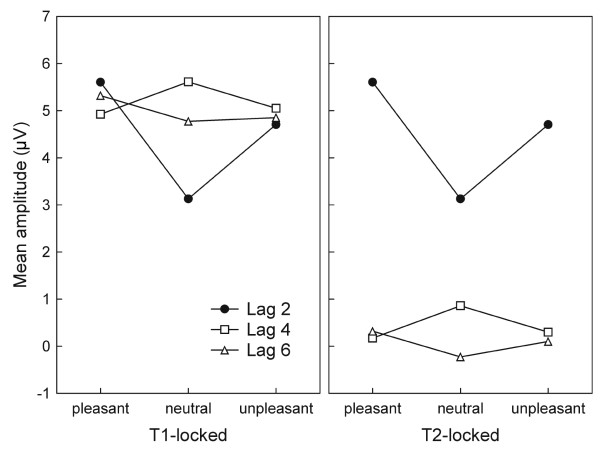
Figure 4.

Interaction plot for the ssVEP. The time-varying amplitude in the time ranges of interest is as depicted in Figure 3. The left panel shows the analysis within a time range relative to T1. Amplitude is selectively decreased following neutral T2s in the lag 2 condition, suggesting interference by T2, which is not present for the arousing T2s (pleasant and unpleasant). Lag 4 and 6 conditions trivially do not exhibit modulation by content in this time range, as T2 occurs later in these conditions. They serve as comparison conditions, showing the enhancement related to T1 alone in the time range of interest. The right panel illustrates the mean amplitude across posterior electrodes at fixed intervals (120–270 ms) after T2 in each lag condition. Lag 2 is identical in both panels, as the post-T2 range was used as a reference for the T1-locked analysis.
