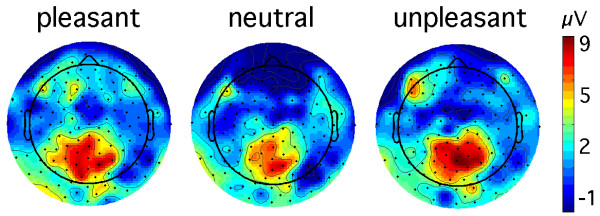
Figure 5.

Topographical maps: cortical response to T2 at lag 2. Topographical distribution of time-varying amplitude, averaged in the time range between 120 and 270 ms, for the lag 2 condition and pleasant, neutral, and unpleasant T2 words. A grand mean across 13 participants is shown.
