
Figure 8.
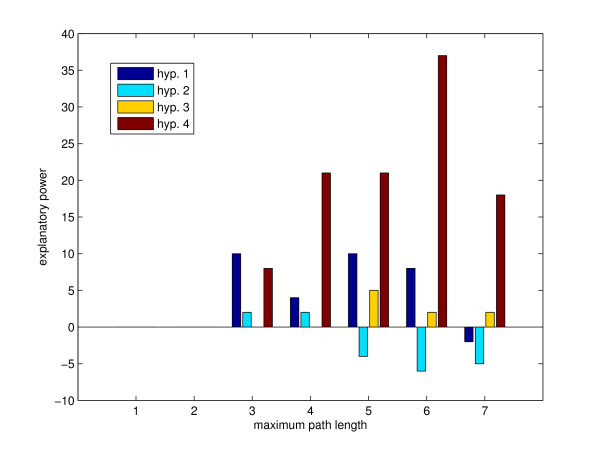
Contribution of each general hypothesis to the model. The gain of explaining power by adding each hypothesis into the model. The gain can be negative if adding the hypothesis contradicts with more perturbation responses than explaining them. Hypothesis 1: blue. Hypothesis 2: cyan. Hypothesis 3: yellow. Hypothesis 4: brown.