
Figure 9.
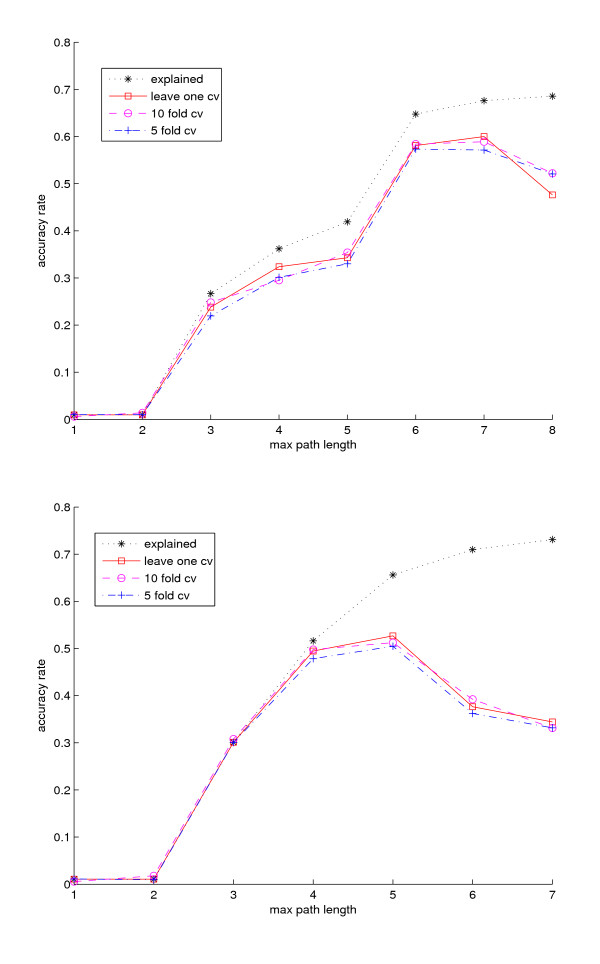
Cross validation accuracy of models with (a) inferred links and (b) general hypotheses. Black stars are the accuracy rates using all perturbation data in the training set. Red squares are the accuracy rates of leave-one-out cross validation. Magenta circles and blue crosses are the accuracy rates of 10-fold and 5-fold cross validation tests.