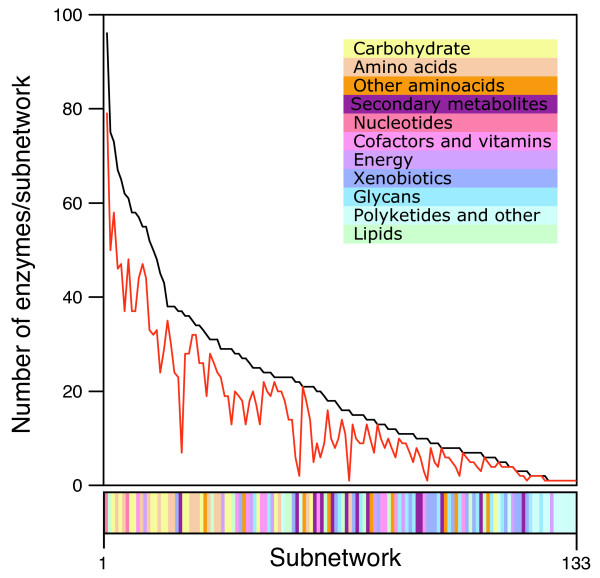
Figure 5.

Painting efficiency in metabolic subnetworks. The plot describes the total number of enzymes (black line) and the total number of painted enzymes (red line) in each of the 132 subnetworks described in KEGG, sorted according to enzyme number. Subnetworks belonging to individual mesonetworks are identified with different colors.
