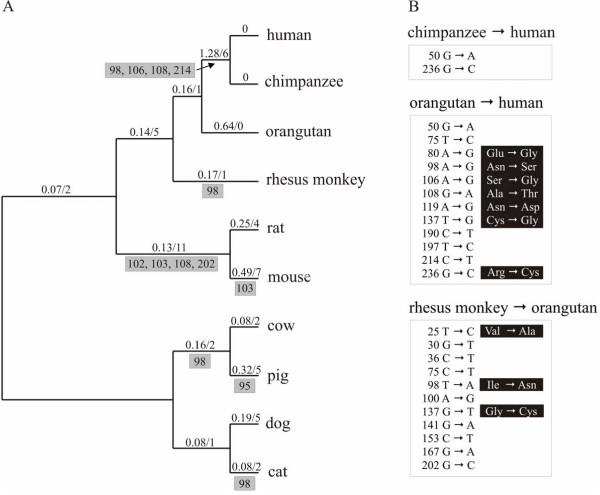
Figure 10.
Selective pressures across the different eutherian mammal lineages. A) ML phylogeny of placental mammal HADH2 genes. The numbers above the branches are the ω ratio (left) estimated under the free-ratio model using PAML and the number of sites (right) that showed destabilizing selection among the physicochemical properties tested using TreeSAAP. A ω >1 suggests that positive selection has acted along that lineage; a ω = 0 reflects the absence of nonsynonymous substitutions. Below the branches, grey boxes list the sites showing destabilizing selection belonging to important functional regions of the protein (see table 3). The analysis was conducted using an unrooted topology (the topology is rooted for convenience). B) Nucleotide substitutions that occurred among great apes and between orangutan and rhesus monkey. The numbers refer to codon positions; for the nonsynonymous substitutions is listed the corresponding amino acid changes.

