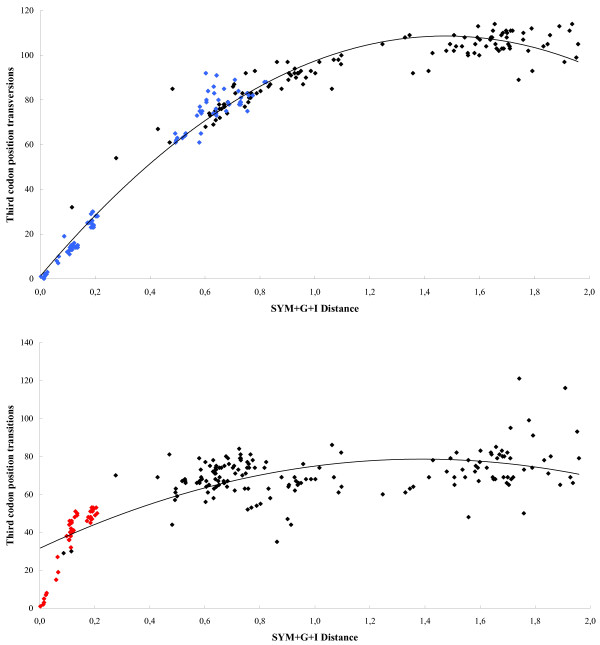
Figure 6.
Saturation plots of third codon position transitions and transversions versus corrected pairwise sequence divergence. All comparisons between vertebrates and invertebrates are shown. The dots coloured blue in the first plot are for vertebrate pairwise comparisons, showing that third codon position transversions are not saturated for vertebrates, starting to saturate only for pairwise comparisons involving the invertebrate sequences. The dots coloured red in the second plot are for pairwise comparisons among eutherian mammals (the small saturation observed is due to some pairwise comparisons involving the mouse and rat sequences).

