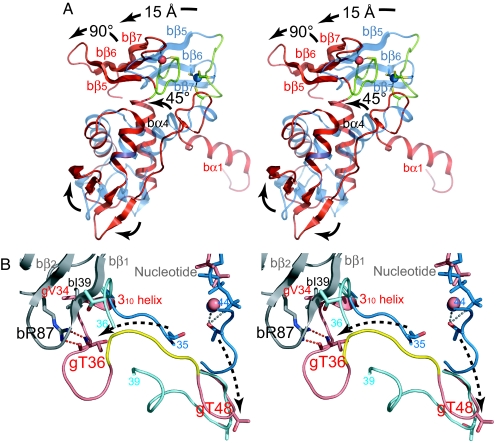
Fig. 4.
Structural comparisons. (A) Comparison of the β-subunits in the βγ complex (red) and the uncomplexed form (blue) by superposing the Cα atoms of HTH (residues 35–89) with the program TOP3D (25). The loop between bα4 and bβ5 encompassing the N-terminal half of the C2-C2 zinc-binding motif is shown in green. Major conformational changes are indicated with arrows. (B) Comparison of the Sw1 of the γ-subunit in PfIF2βγ–GDP (pink), aIF2αγ–GDPNP (blue), and aIF2γ–GDP (cyan) by superposing the G domains with the program TOP3D. The β-subunit is shown in gray. The conserved EEΦ(R/K)R motif in the βγ complex is colored yellow. The residues between 35 and 44 in αγ–GDPNP and 36 and 39 in γ–GDP are disordered. Dashed arrows indicate the possible conformational change of Sw1 between the GDPNP and GDP forms.

