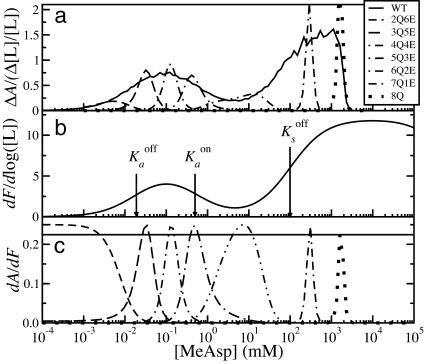
Fig. 4.
Two peaks of receptor response to MeAsp. (a) Theoretical receptor response ΔA/(Δ[L]/[L]) for mixed clusters of receptors as a function of ambient MeAsp concentration ([L]) for Δ[L]/[L] = 10%. Curves show responses of adapted (WT) and nonadapting (xQyE, where x and y are the number of glutamines/methyl groups and glutamates, respectively) receptors. Plotted are averages over 100 independent simulations for clusters of 18 receptors, 6 Tar, and 12 Tsr. (b and c) Analytical results for single mixed cluster. (b) Methylation independent dF/dlog([MeAsp]); also shown are the MeAsp dissociation constants for Tar (a) and Tsr (s) receptors. (c) dA/dF; WT is assumed to adapt for all MeAsp concentrations. Key applies to a and c.

